Core App Dashboard for Monitoring Application Activity & Performance
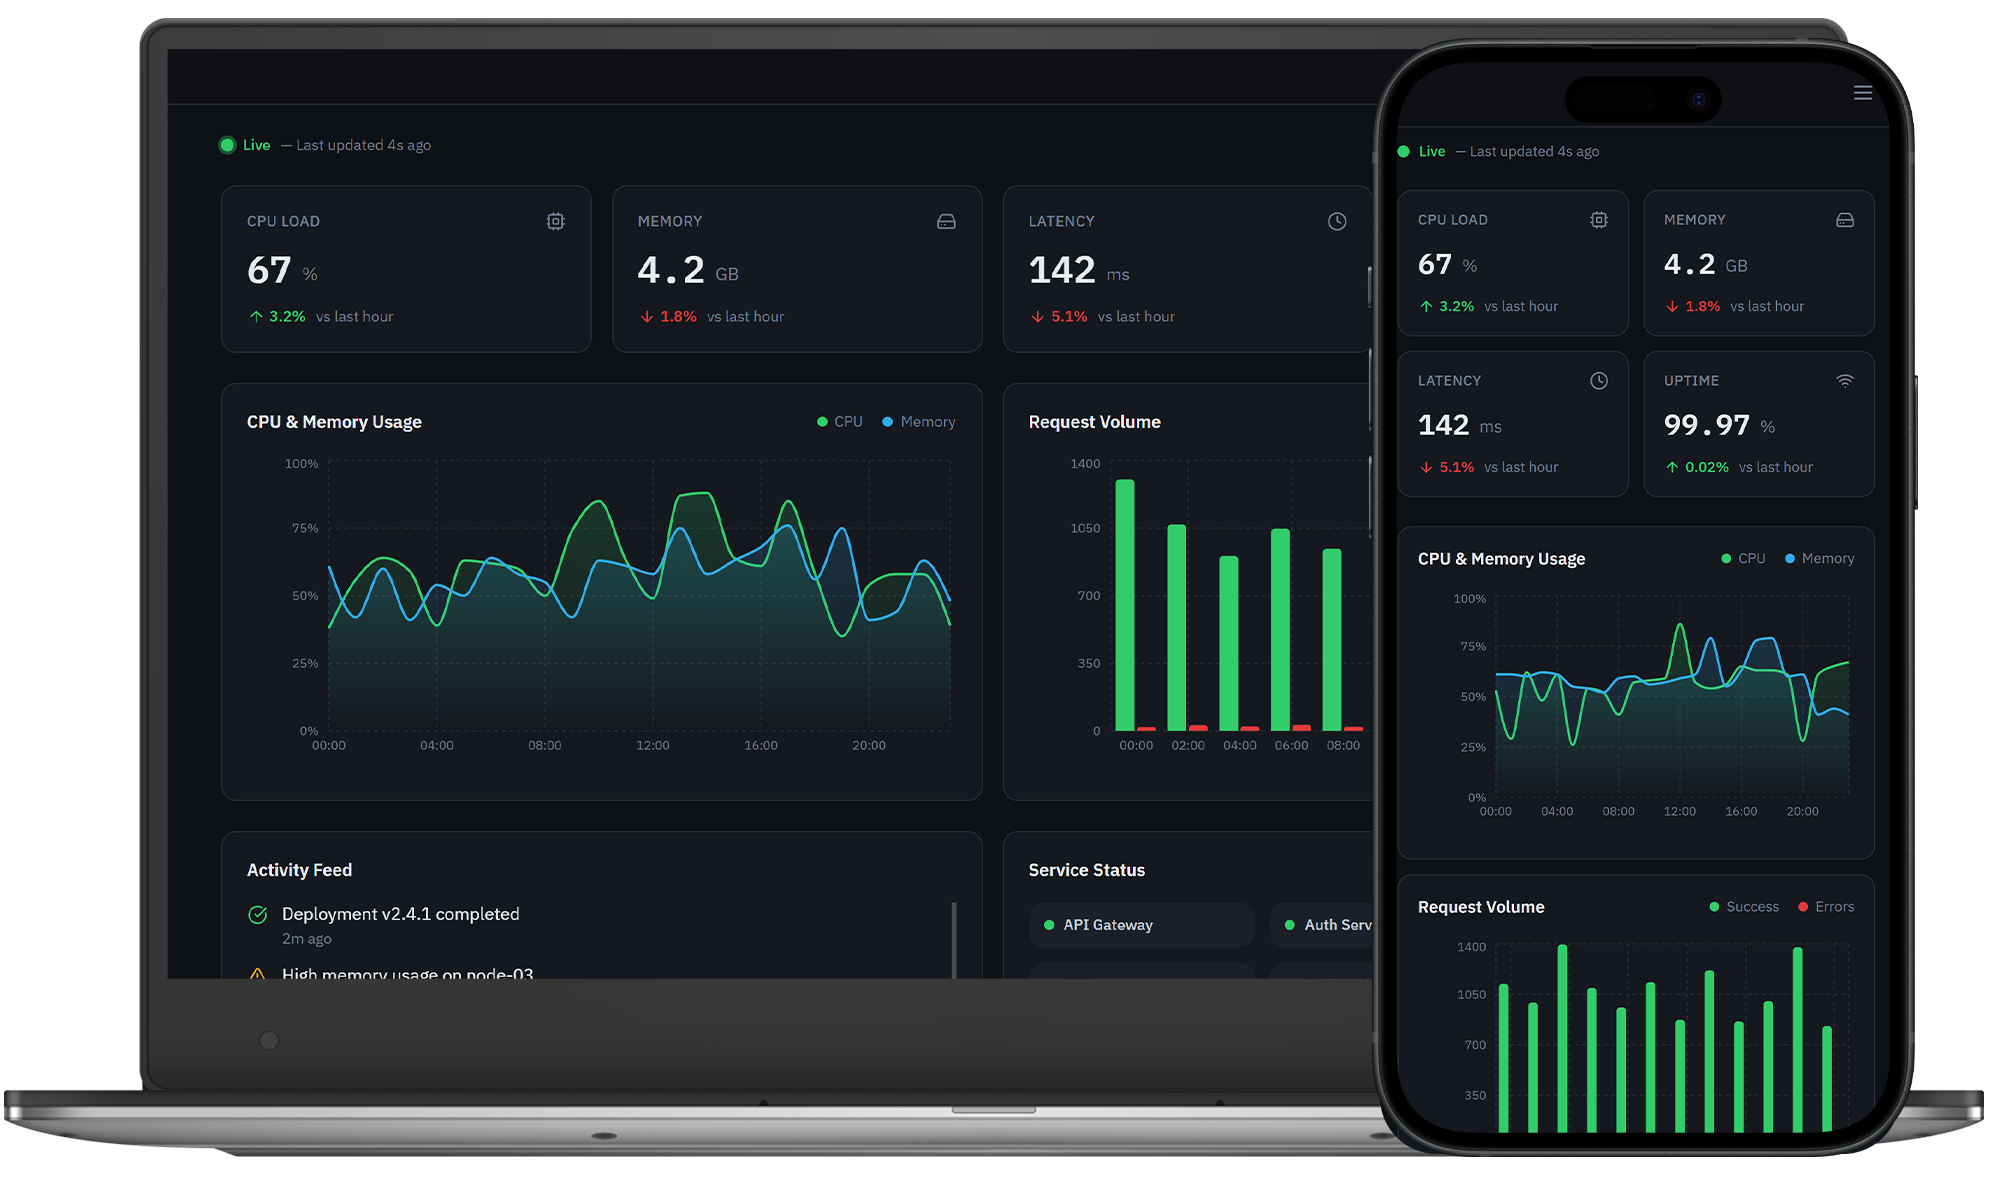
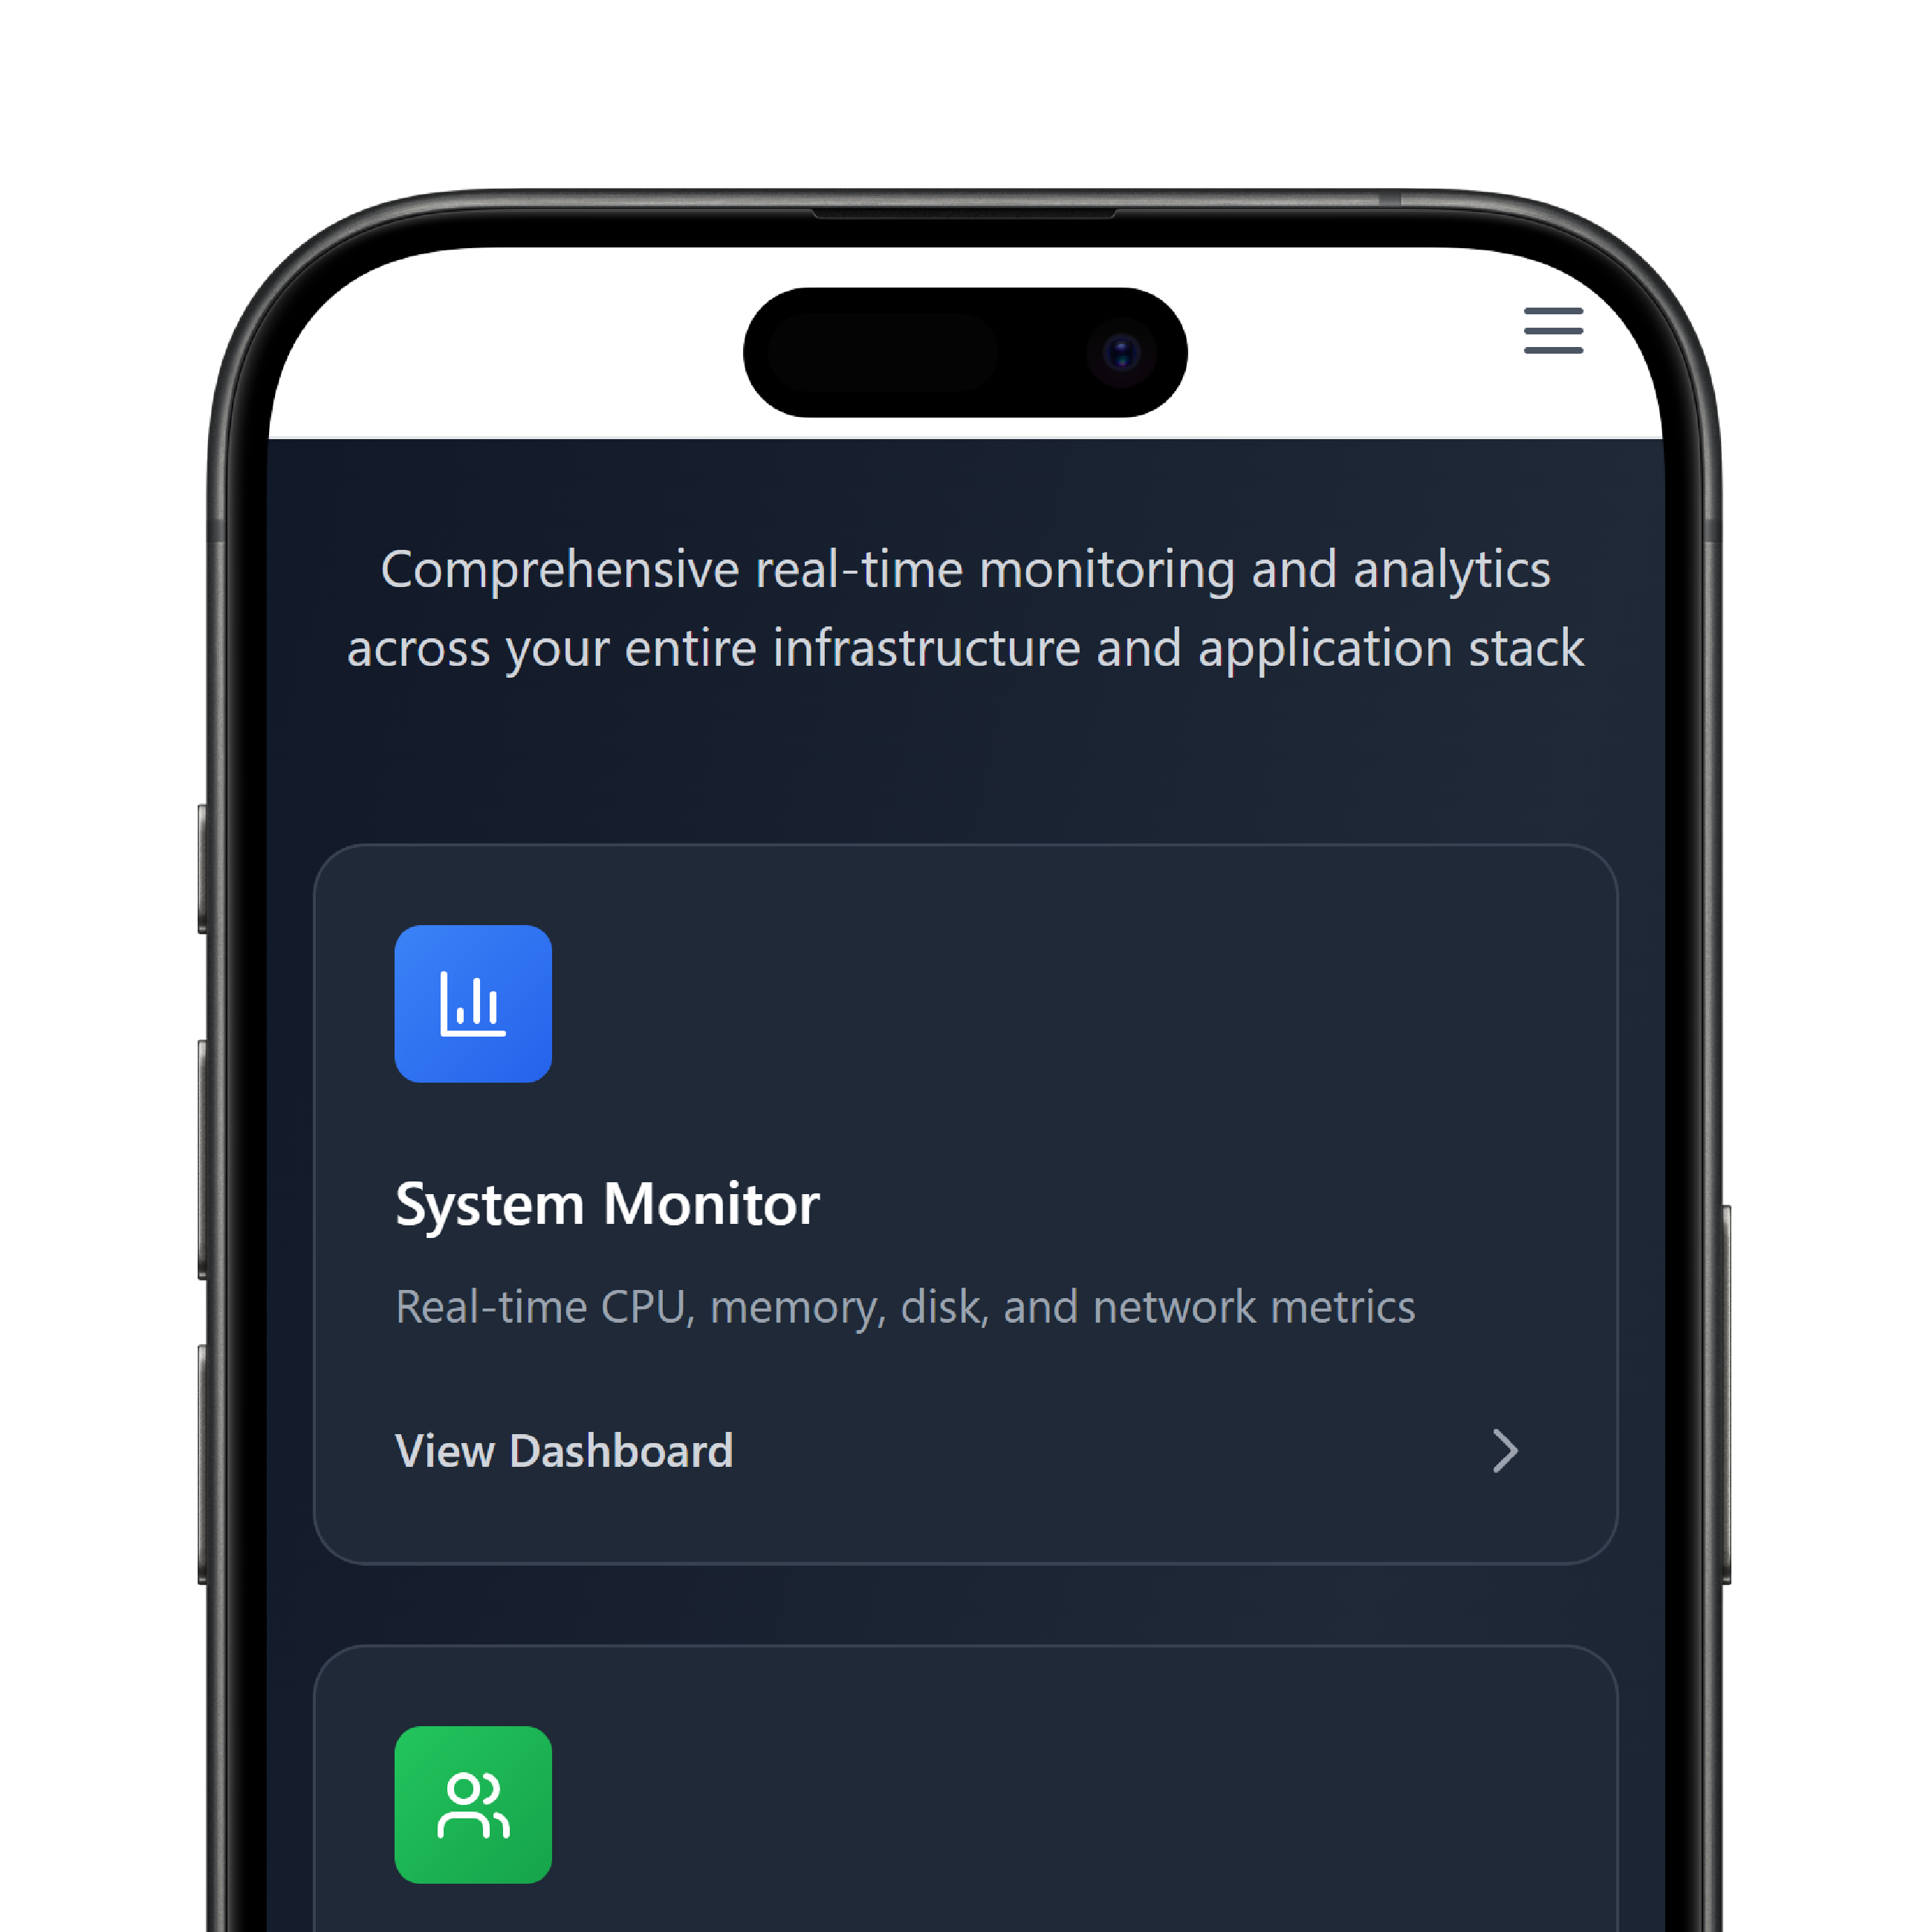
Monitor operational behavior, track usage, and manage application metrics through a centralized control interface. DrapCode provides a core app dashboard that visualizes workflows, system health metrics, and real-time operational insights.
Monitoring Framework
A core app dashboard consolidates application data, user activity tracking, and operational signals into one interface. The DrapCode dashboard enables teams to observe behavior across modules without navigating multiple systems. Organizations use centralized data dashboards to improve visibility and operational awareness. Teams can review actions, monitor usage, and manage system operations from a single environment.
System Data Architecture
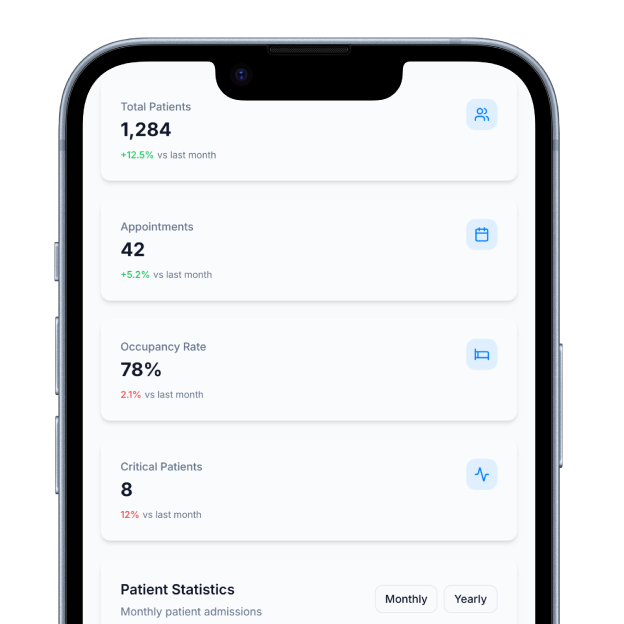
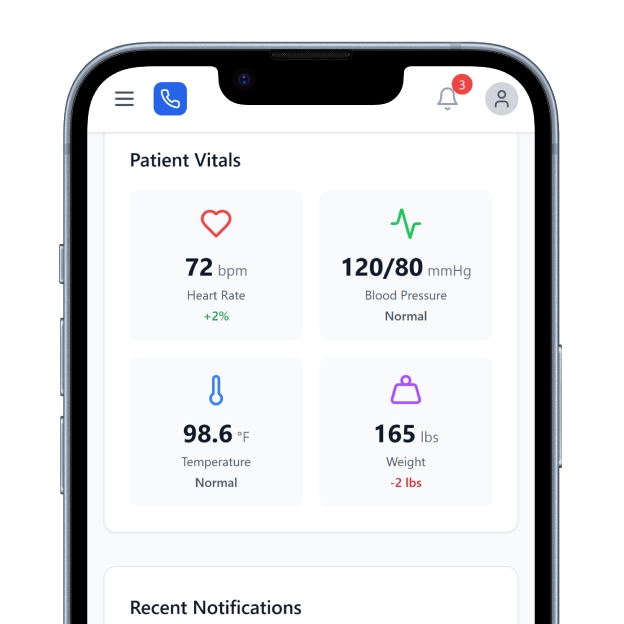
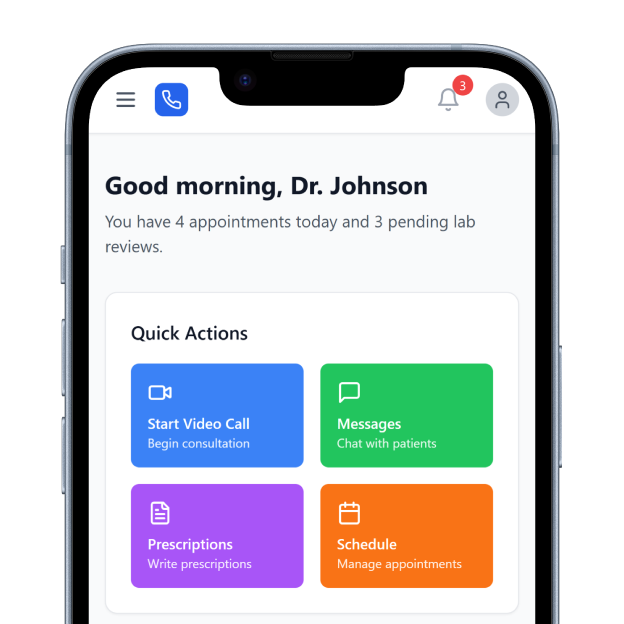
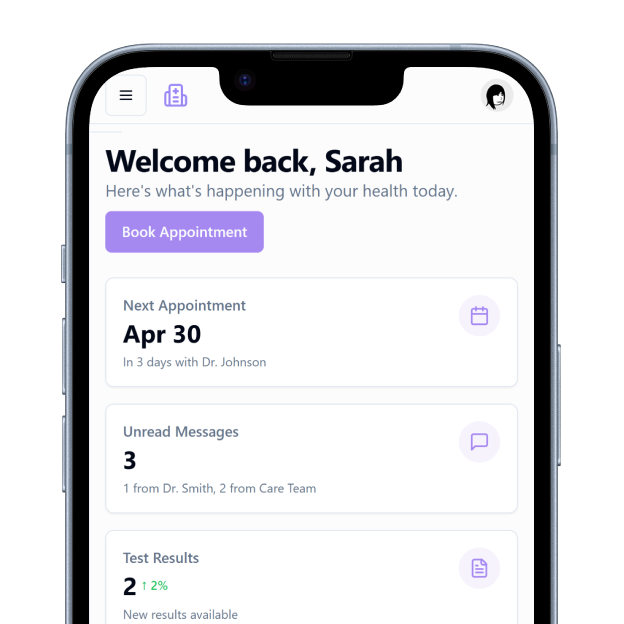
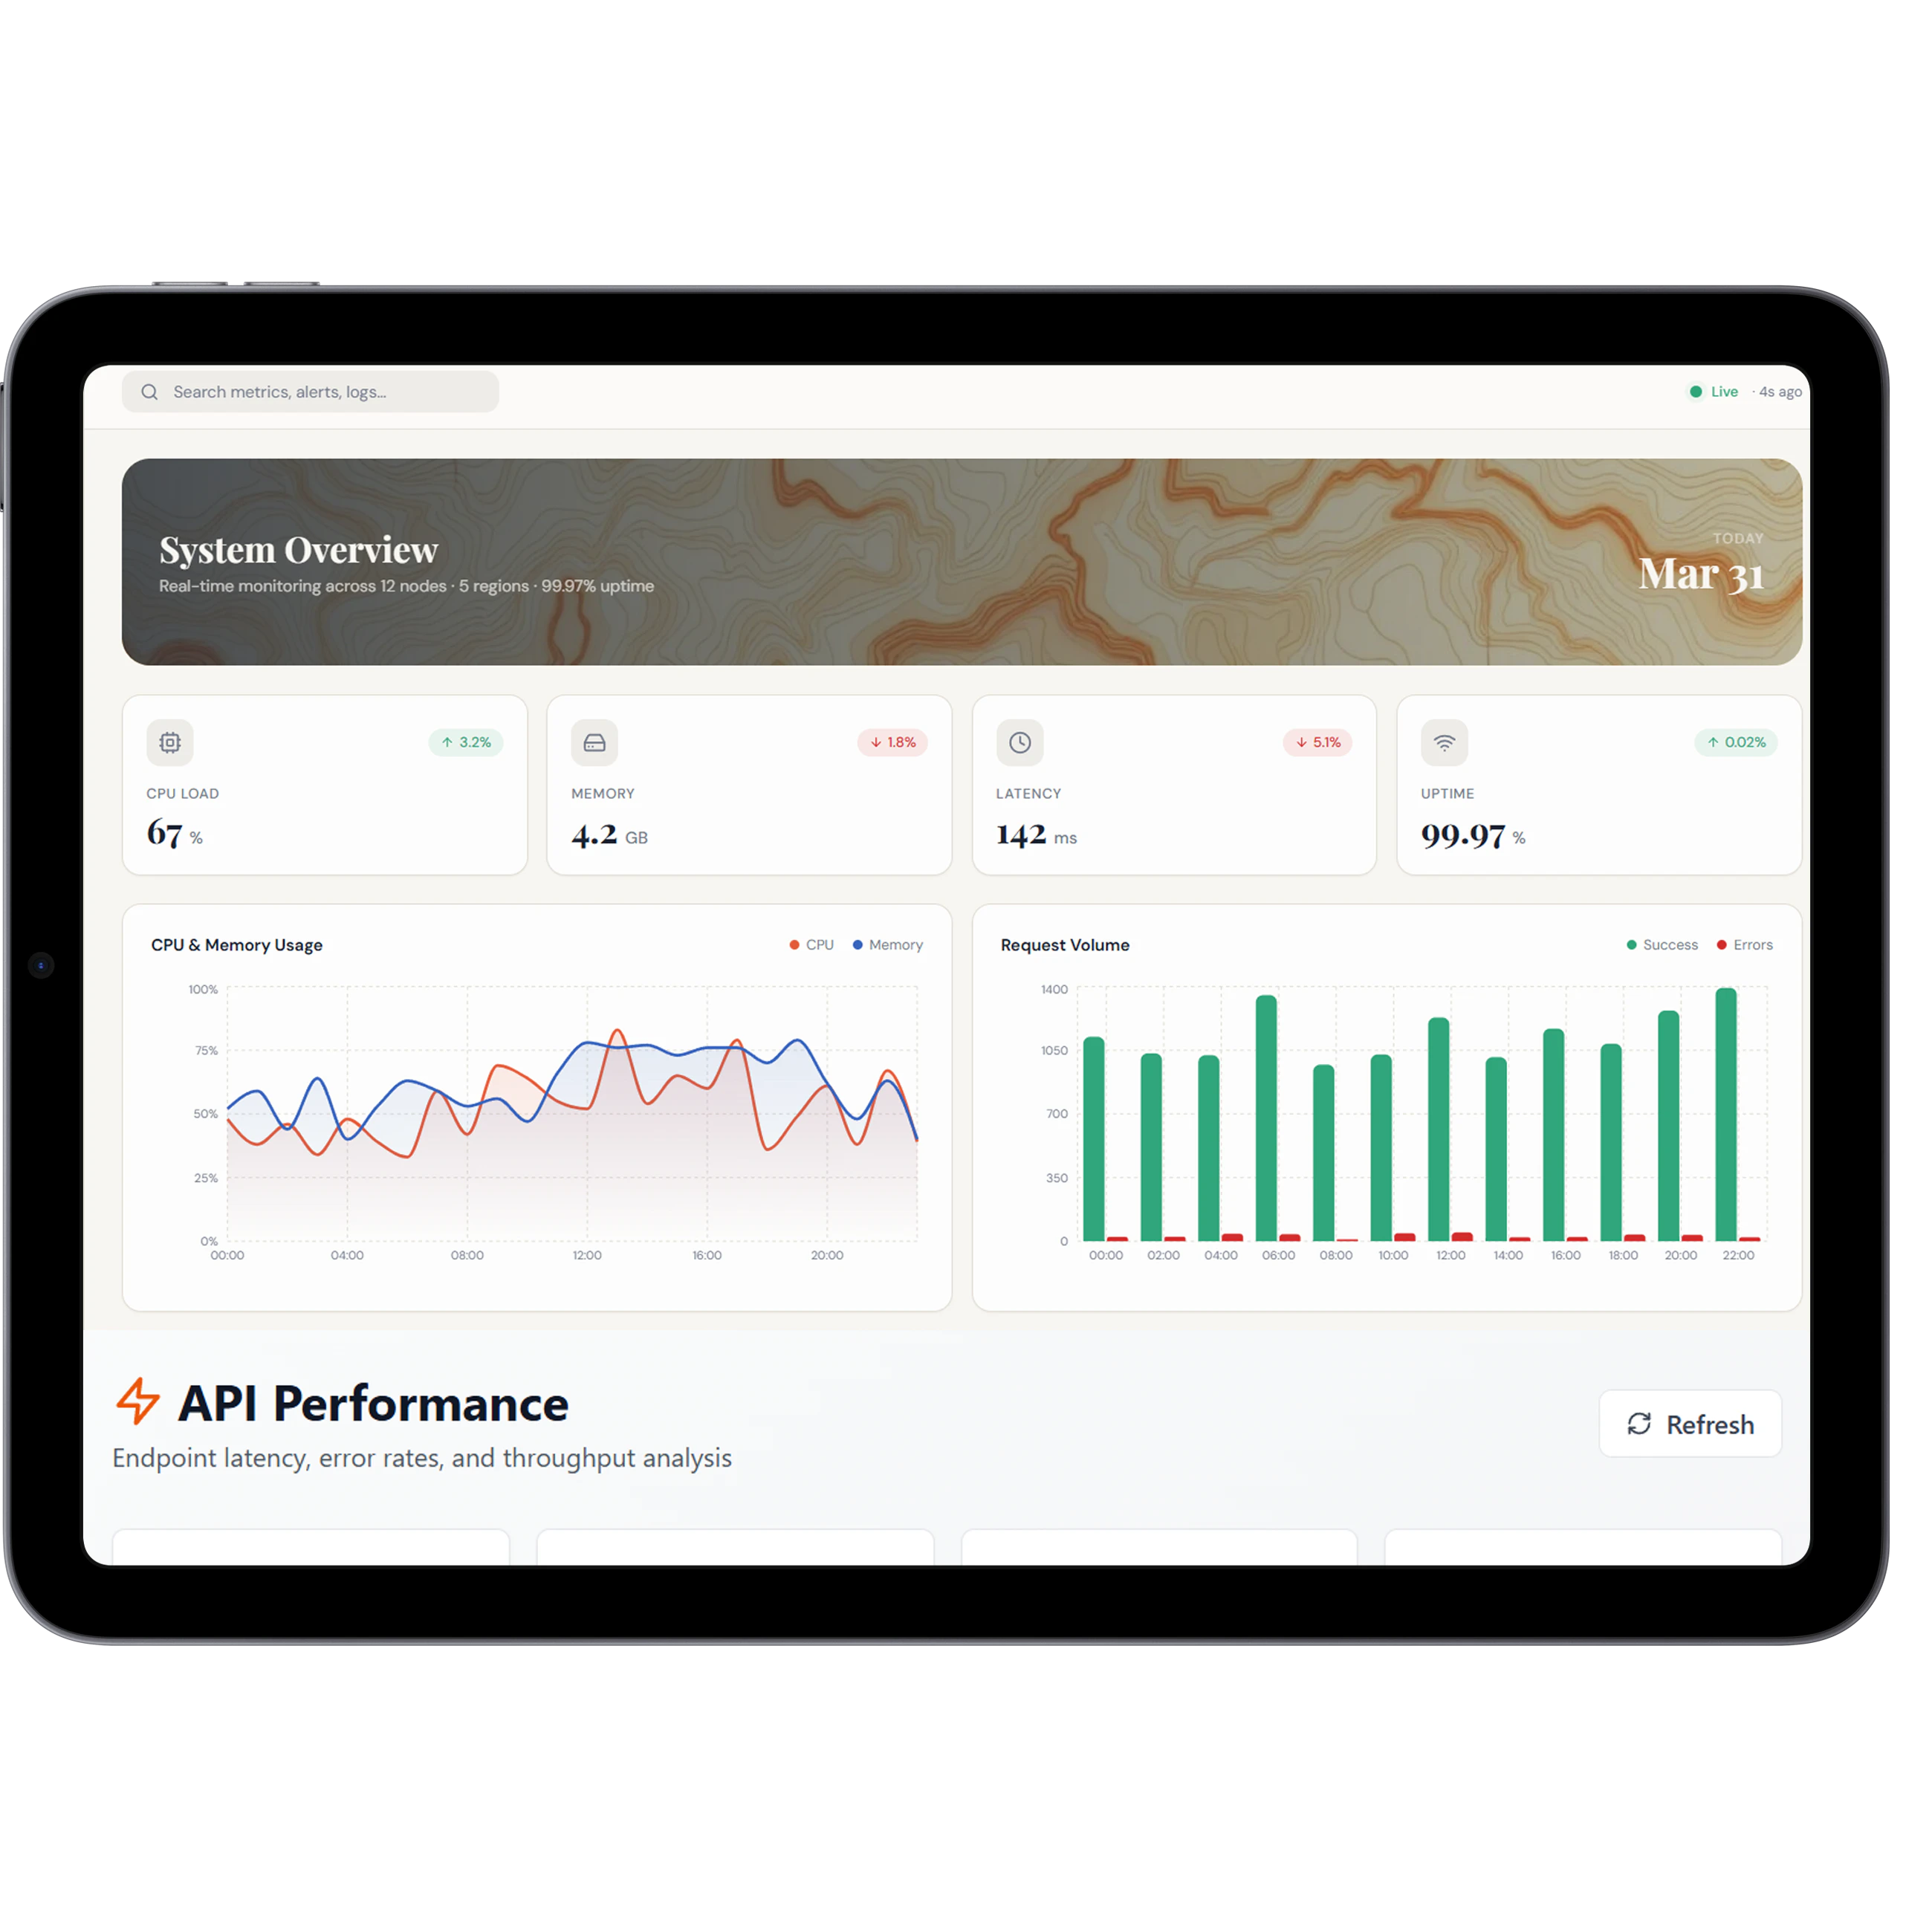
The dashboard aggregates logs, transactions, and workflow events into structured visual metrics. Applications display performance indicators that help teams quickly detect operational deviations. Industry platforms, including healthcare systems , rely on centralized monitoring andvisibility. Financial operations can also track processing activity within digital lending platforms.
Dashboard Functional Capabilities
These features define how DrapCode delivers application monitoring and analytics visibility.
User Activity Tracking
Record actions, sessions, and interactions across application users
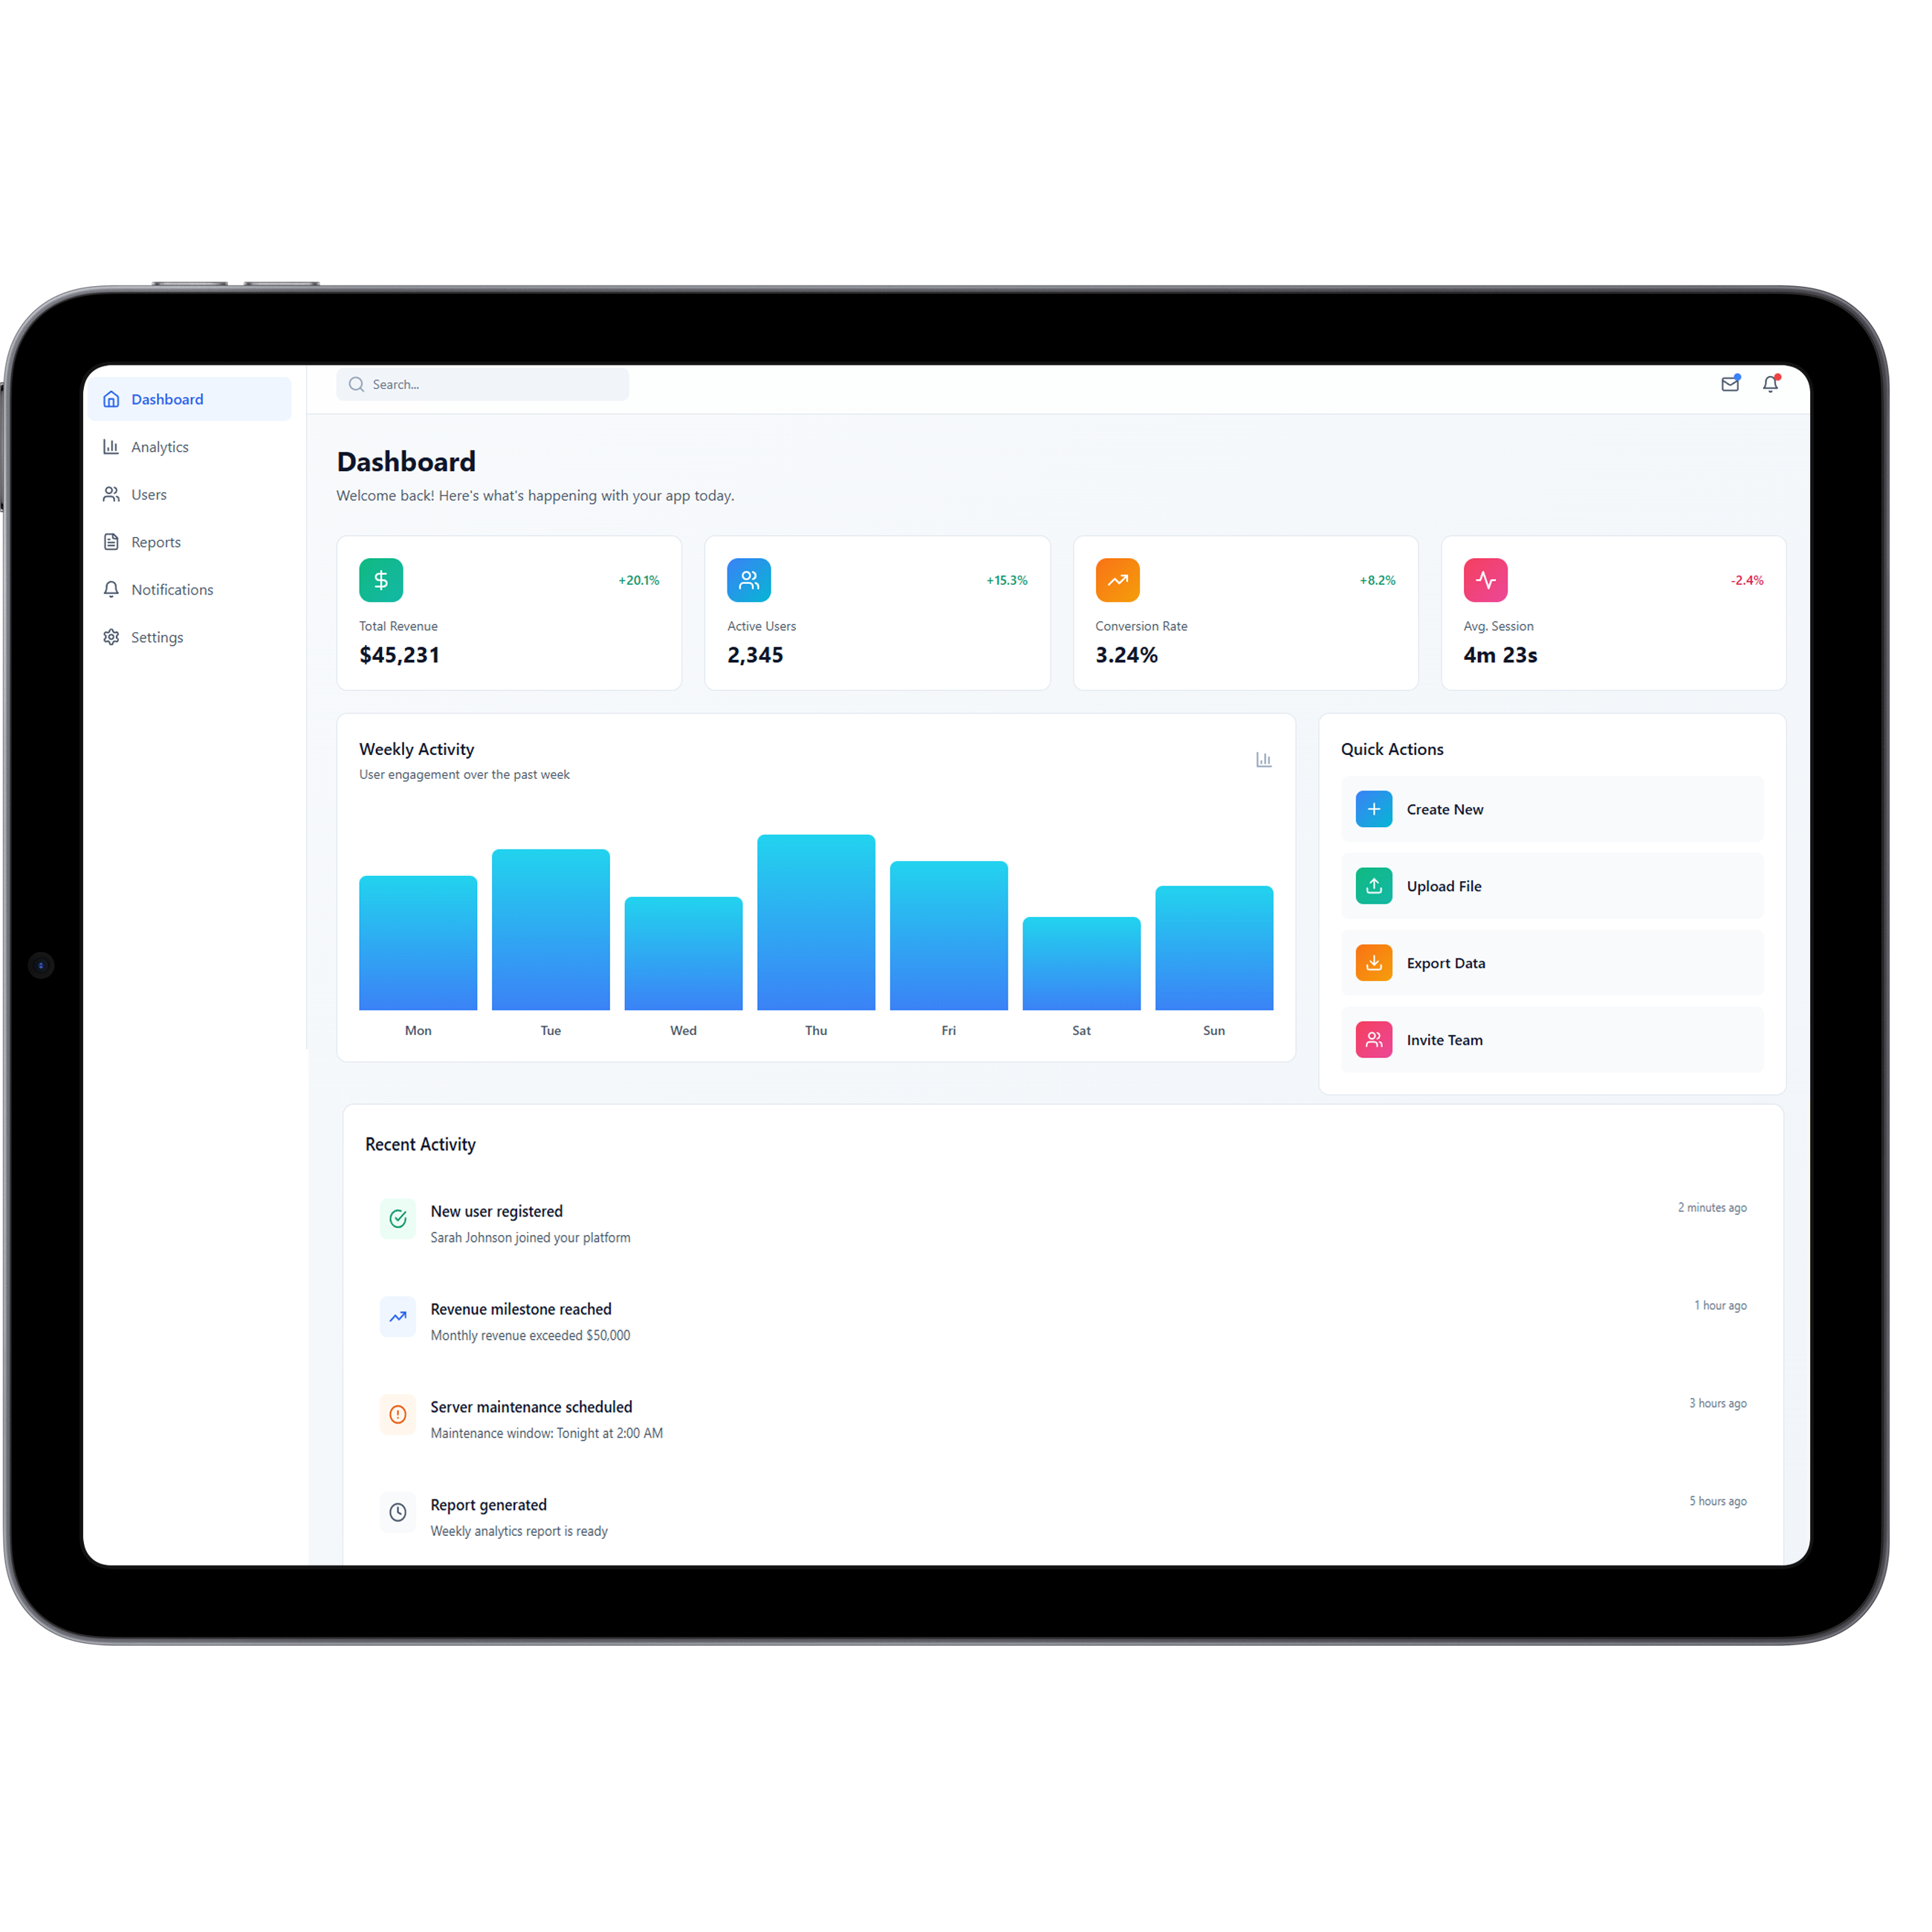
Custom Analytics Dashboard
Visualize operational metrics using configurable reporting views
Application Performance Dashboard
Monitor response time errors and execution latency trends
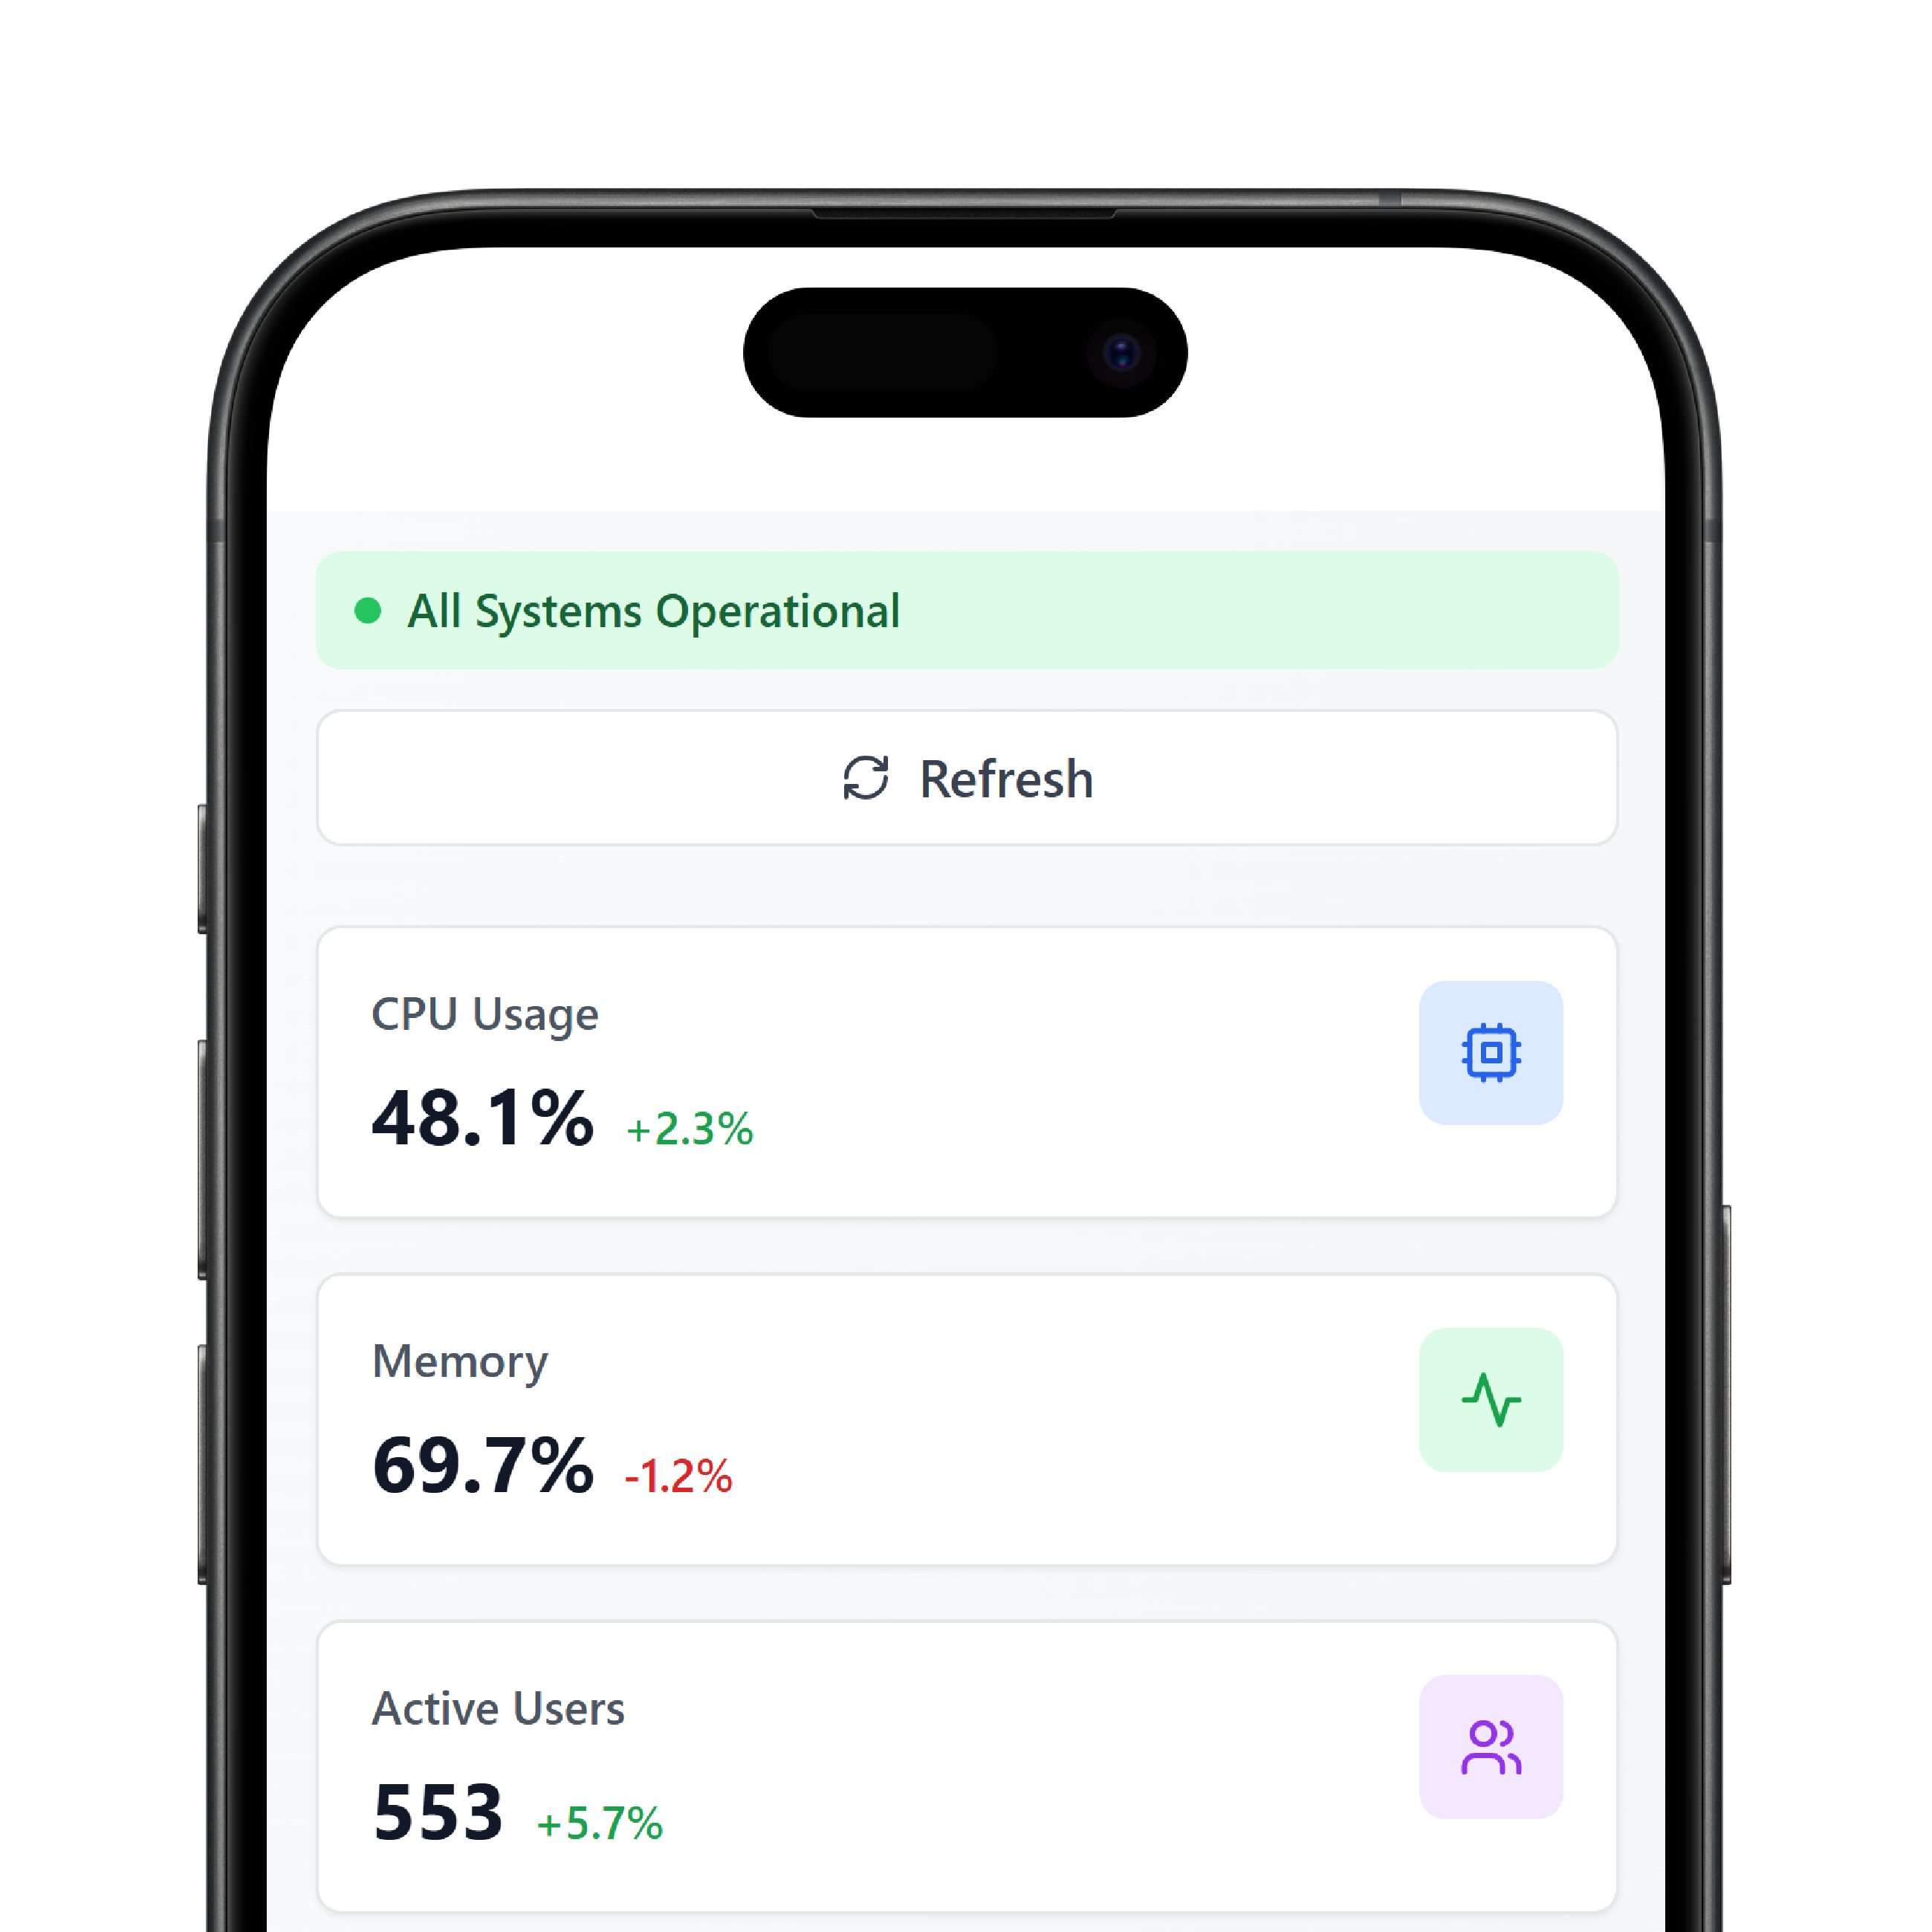
System Health Metrics
Detect resource utilization and operational stability indicators
Centralized Data Dashboard
Combine log events and workflow analytics into one interface
Core App Dashboard Login
Provide secure, authenticated access to the monitoring environment


We partnered with DrapCode to develop our new Automated CRM using their low-code platform. Outstanding quality at half the price, unmatched speed, and excellent customer service.
Cal Goggans
Founder - A Custom Fit iNMotion


DrapCode stands out as the best. Flexible, scalable, and supported by an expert team. After 3 years on another tool, DrapCode is simply superior.
Cory Nation
President - Embark EMR


DrapCode is an easy-to-use no-code platform with a drag-and-drop interface, making it accessible for non-developers. The support team is highly responsive and dedicated to user success.
Joseph Young
President - Renew Hope And Healing
Platform Operational Capabilities
Operational controls ensure reliability and continuous monitoring performance.
Real Time Data Refresh
Update dashboard metrics continuously without manual reload
Role-Based Visibility
Display analytics based on user responsibilities and permissions
Secure Access Controls
Protect operational insights using authenticated access management
Cross Application Monitoring
Observe multiple connected systems from one interface
Implementation Scenarios


Enterprise Platforms
Observe data across integrated business systems. Extend monitoring into the AI platform environment.
Dashboard Deployment Workflow
Monitoring environments follow a structured activation process.
 Connect Sources
 - Configure Metrics
- Assign Access
- Activate Dashboard
Connect Sources
Integrate application data streams
Configure Metrics
Define analytics and monitoring views
Assign Access
Set visibility permissions for users
Activate Dashboard
Launch centralized monitoring interface
Operational Transparency
Scalable Monitoring Infrastructure
Frequently Asked Questions
What is a core app dashboard?
Can teams track user actions in real time?
Does the dashboard support multiple applications?
Is login access restricted?
Why is a centralized dashboard important?
Get started with DrapCode to monitor applications using a centralized core app dashboard.
Experience the power of no-code development with DrapCode Studio. Build apps visually, collaborate seamlessly, and launch faster than ever.